How Sugar Cosmetics Improved CTR From 0.25% to 0.80%
Sugar Cosmetics has always owned its space with no-filter, unapologetic branding — carving a niche by creating makeup for Indian skin tones. But on Amazon, the product pages weren’t carrying that same sparkle. RB2F stepped in to give the listings an A+ content makeover worthy of the brand.

Sugar Cosmetics needed product pages with more personality to match their brand energy.
An imagery audit found Amazon-guideline compliance issues, unclear USPs, and pale visuals.
RB2F redesigned every image and infographic to be “add-to-cart worthy.”
The result: CTR improved from 0.25% to 0.80%, 40% QoQ revenue growth, and fewer returns and negative reviews.
The Challenge, The Fix & What Went Down
Three stages, one continuous fix — step through each one below.
Product Pages Missing the Brand’s Signature Energy
Sugar Cosmetics needed product pages with real main-character energy to match the rest of their brand. That’s where RB2F stepped in — to give their listings a glow-up worthy of a glam squad.
An A+ Content Makeover Built for Amazon
On completing an audit of the existing imagery, RB2F found three specific gaps holding CTR back:
Guideline compliance issues
Inconsistent images that weren’t in line with Amazon’s own listing guidelines.
Unclear USPs
Value propositions weren’t coming through in the imagery itself.
Pale visuals
The imagery undersold a brand built on bold, no-filter energy.
Lifestyle Shots, EBC Templates, and Bold Swatches
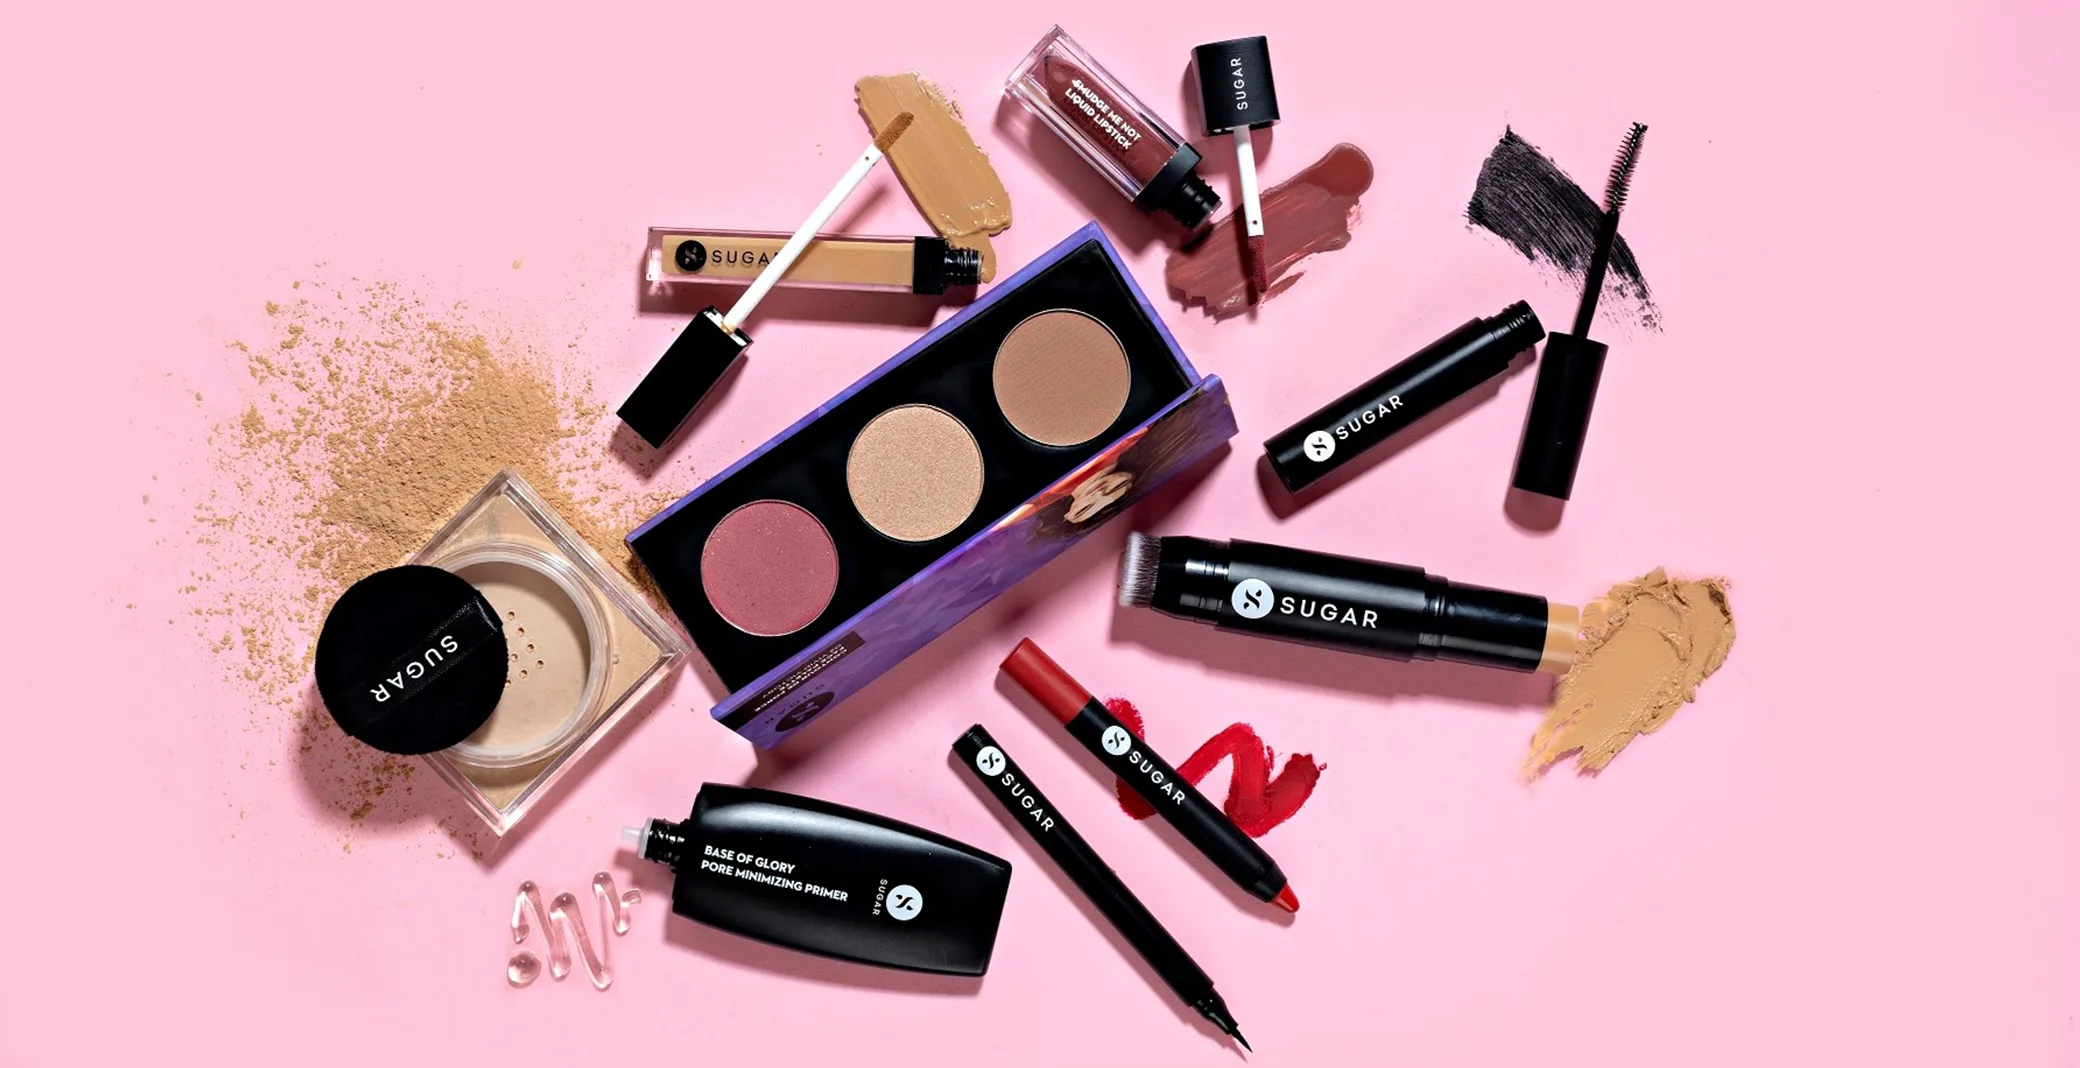
With a complete makeover, the team styled, shot, and designed creatives that reflected the brand’s value — replacing short text phrases with infographics to make every image more readable and more “add-to-cart worthy.”
Lifestyle shots that hit.
High-impact photography built to stop the scroll and show the product in real use.
EBC templates that sell.
Clean, on-brand Enhanced Brand Content templates built to convert, not just decorate.
Clear, scroll-stopping messaging.
Short text phrases replaced with infographics so every USP reads instantly.
0.80% CTR and 40% QoQ Revenue Growth
The A+ content makeover moved every metric that mattered:
Average CTR
Up from 0.25% before the redesign.
QoQ revenue growth
Sustained growth following the content relaunch.
Returns & negative reviews
More sales, fewer customer returns and negative reviews.